Most of us have seen blood check reports which show various values indicating changes in many health conditions. Though it is difficult for a non-medical person to understand their implications, most are able to compare the results with the normal values.
Certain indices of red blood cells had always been a part of the report which many people do not understand at all. In this article, we are trying to simplify those red blood cell indices for an easier understanding and knowledge.
In order to grasp the complete sense of indices such as MCV, MCH, MCHC etc, it is of utmost importance to have a general idea about blood and its components.
Blood
Blood, as everyone knows, is the fluid that circulates throughout the body due to the pumping action of heart. The main functions of blood include carrying nutrition to the tissues, removing the toxic and unwanted materials from tissues and transport of oxygen to and carbon dioxide from the tissues.
Lot of other functions are also carried out in the body by our blood. It has various components which helps it to complete these functions effectively.
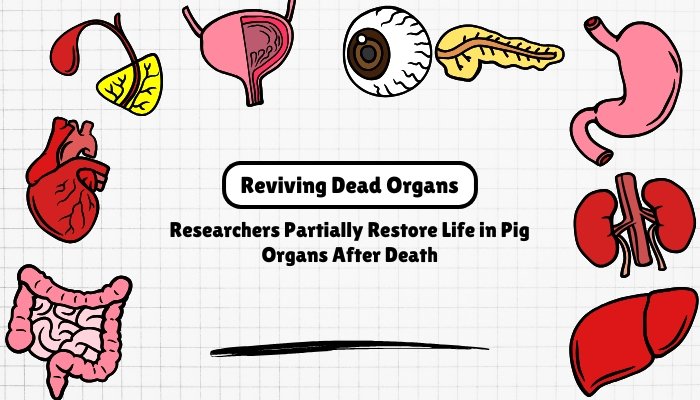
On an average, an adult has approximately 5 litres of blood that circulates within the blood vessels of the body (1). This volume is regulated by the kidneys. The volume of blood in a person varies in different age group and between male and female genders. To understand the composition of blood, it is easier to consider it as a liquid portion and the cellular portion.
The liquid part of blood is known as plasma which constitutes about 55% of the blood volume (2). Remaining 45% is made up by the blood cells. Plasma is approximately 92% water and rest includes suspended particles such as proteins, minerals, electrolytes, hormones etc (3).
The cellular portion of the blood includes Erythrocytes (Red blood cells/RBC), Leucocytes (White blood cells/WBC) and Thrombocytes (Platelets). There are about 4.7- 6.1 million RBCs per microliter of blood in males and about 4.2 – 5.4 million RBCs per microliter of blood in females (4).
In addition there are about 4,000- 11,000 WBCs and 200,000- 500,000 platelets per microliter of blood (5).
Picture 1: An image showing content of blood.
Image Source: www.alhijamah.com
Erythrocyte (Red Blood Cell/ RBC)
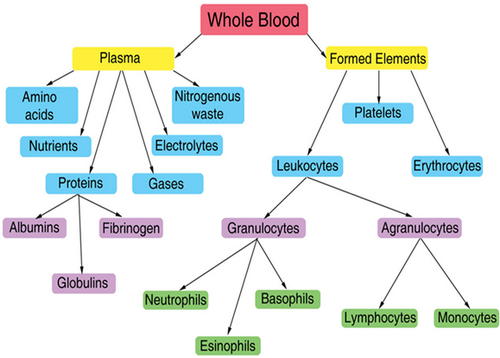
They are the most abundant cells in the blood. This is because they carry out one of the major functions of the blood, oxygen and carbon dioxide transportation. To facilitate this function, RBC has a biconcave (both the surfaces are concave) oval disc shape, that allows it to bend, twist or change shape while passing through narrow passages.
On a cross section, they appear more like a dumbbell because of its central depression on both the surfaces. In the early stages of its development (erythropoiesis), RBC has nucleus which the cell loses as it matures.
This process helps in giving more space for accommodation of haemoglobin. (6)
Picture 2: RBCs in blood.
Photo Source: www.fi.edu
| Total count of RBC | 20-30 Trillion (7) |
| Male | 4.7- 6.1 million/µL of blood (4) |
| Female | 4.2 – 5.4 million/ µL of blood (4) |
| Nucleus | Absent (6) |
| Golgi apparatus | Absent (6) |
| Mitochondria | Absent (6) |
| Endoplasmic reticulum | Absent (6) |
| Life span | 100-120 days (8) |
| Time taken for one complete circulation in the body | Approximately 60 seconds (8, 9, 10) |
| Diameter | 6.2-8.2 µm (11) |
| Thickness at the peripheral part | 2- 2.5 µm (6) |
| Thickness at the centre | 0.8- 1 µm (6) |
| Average volume | 90 fL (12) |
| Volume when swollen up with non-distended membrane | up to 150 fL (6) |
| Surface area | 136 µm2 (6) |
| Hemoglobin content in each RBC | Approximately 270 million molecule/RBC (6) |
Table 1: General features of a mature RBC.
When a complete blood count is advised, the following tests related to RBCs are done.
RBC count, Hematocrit/ Packed cell volume (PCV), Hemoglobin (Hb), Mean corpuscular Volume (MCV), Mean corpuscular haemoglobin (MCH), Mean corpuscular haemoglobin concentration (MCHC), RDW, Reticulocyte count.
Hemoglobin (Hb)
Hemoglobin content of RBC is what decides the oxygen carrying capacity of blood. Structurally it is made up of iron and a protein (globin). At the same time, the red colour of blood is due to Hb. It becomes bright red when oxygenated and dark red when deoxygenated (13).
The normal levels of Hb in Male are about 13.8- 18.0 g/dL and in Female are about 12.1- 15.1 g/dL (14). When the hemoglobin content reduces in the blood, the condition is called as Anemia. Conversely, when it increases above the normal range, polycythemia ensues.
Anemia can be explained by decrease in hemoglobin levels, haematocrit values or RBC count (15).
RBC Count
RBC count is generally measured as number of cells per micro litre of blood. It is seen that the count decreases in anemia and increases in polycythemia.
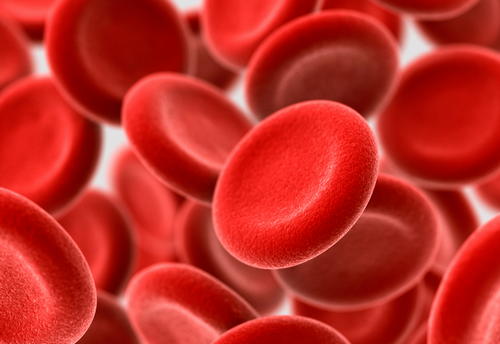
Hematocrit/ Packed cell volume (PCV)
Picture 3: An image showing the Hematocrit assessment. The bottom part showing RBCs forms the hematocrit.
Image Source: image3.slideserve.com
PCV is another component of a complete blood count, which indicates the RBC component of the blood in percentage. The normal value of PCV in men is about 42% to 50% and in women it is about 36% to 45% (16). As seen above, it is noted that the haematocrit values decrease in anemia and increase in polycythemia.
Hematocrit is nowadays measured by an automated blood analyser. Imagine that RBCs are stacked together. The volume of these cells together can be calculated by volume of one cell multiplied by the number of RBCs, which is Mean Corpuscular Volume (MCV) multiplied with the total count of RBCs (17).
Another method of finding hematocrit values is by using differential spectrophotometry (18).
Certain condition where the fluid portion of blood is decreased, the hematocrit is increased. When oxygen in blood is less, body tries to make more RBCs which will lead to a rise in hematocrit (19).
Causes of increased or decreased hematocrit
| Increased hematocrit | Decreased hematocrit |
| Dehydration (20) | Anemia (17) |
| Decreased plasma level (17) | Pregnancy (17) |
| Dengue fever with Dengue Shock Syndrome (17) | Acute myeloid leukemia (17) |
| Polycythemia vera (17) | |
| Chronic Obstructive Pulmonary Disease (COPD) (17) | |
| Capillary leak syndrome (17) | |
| Staying in high altitudes for longer time (19). | |
| Drugs- Anabolic steroids such as Oxymetholone, Boldenone. (17) |
Table 2: Showing causes of increased or decreased hematocrit.
RBC Indices
Now we know the average size of an RBC and the hemoglobin content in each RBC. To check if these values are normal in a person, we need to have a little more detailed information from his or her blood. These details are called RBC indices.
They are Mean Corpuscular Volume (MCV), Mean Corpuscular Hemoglobin (MCH), Mean Corpuscular Hemoglobin Concentration (MCHC), RBC Distribution Width (RDW) and Reticulocyte count. Usually first three of them are done whenever a complete Blood Count is requested to a diagnostic centre.
Many diagnostic labs do not do RDW and Reticulocyte count. With the modern facilities, most of the centres now give a report with all these details as all of them are done by an automated blood analyser.
Why do we need to know RBC indices?
As we have seen before, hemoglobin inside the RBC is responsible for the transport of oxygen to the tissues. When oxygen is not delivered sufficiently, the cell health will be affected. This can happen in anemia where the hemoglobin levels or RBC counts have decreased.
To identify the type of anemia and its effect on RBCs, we will have to know about the RBC indices.
What is Anemia?
Anemia can be defined as a decrease in hemoglobin levels or RBC count or hematocrit values below the normal range (15).
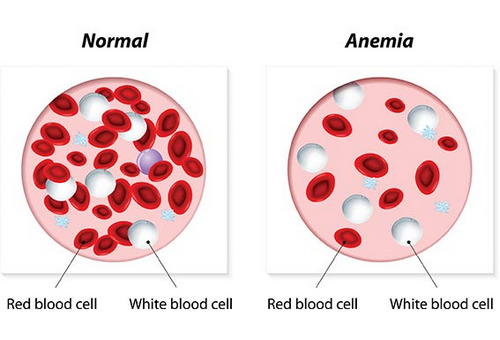
Picture 4: An image depicting a comparison between a normal person’s blood and an anemic person’s blood.
Photo Source: www.petmd.com
What are the causes of Anemia?
Causes of anemia are many and their diagnostic approach is also different. In general, there are a few causes that can be remembered easily.(15)
- Iron deficiency- Due to reduced intake, reduced absorption or due to blood loss (22).
- Vitamin B12 and Folic acid deficiency
- Long standing inflammatory conditions or diseases- Seen in chronic kidney disease, Diabetes mellitus, severe trauma etc (23).
- Anemia due to hemolysis (Breakdown of RBC)
- Anemia due to drugs- Cephalosporins, penicillins, non-steroidal anti-inflammatory drugs (NSAIDS), Quinine etc have been reported to cause haemolytic anemia (24).
- Aplastic anemia- Anemia due to decreased production of RBC
- Hemoglobinopathies- Anemia occurs due to abnormal hemoglobin
- Microangiopathic haemolytic anemia
- Myelodysplastic syndrome
What are the symptoms of Anemia?
Symptoms of anemia develop over a time in case of slowly developing anemia, or may be sudden in case of severe blood loss leading to hypovolemia (reduced blood volume). (15)
When the anemia has caused decreased oxygen delivery to the tissues it can cause
- Difficulty in breathing on exertion or at rest.
- Tiredness
- Palpitation
- Confusion
- Abnormal heart rhythms
- Angina or myocardial infarction (heart attack)
In hypovolemia, anemia may lead to tiredness, muscle cramps, dizziness while changing position, hypotension (decreased blood pressure), shock and even death.
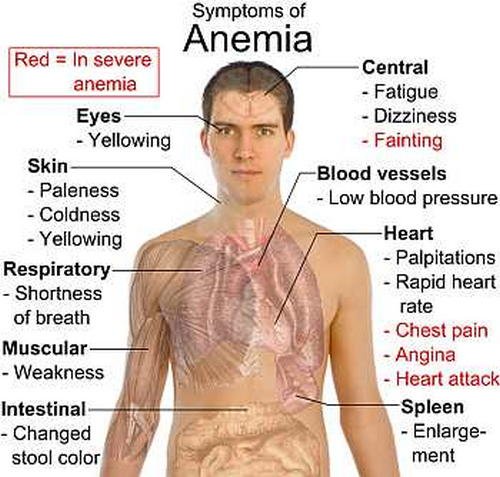
Picture 5: Symptoms of Anemia
Image Source: im.rediff.com
How is Anemia diagnosed?
Diagnosis of anemia involves multiple steps to identify the cause and type of anemia. This include doing a complete blood count with RBC indices, a peripheral smear to visualize the size and shape of RBCs, evaluation of iron content of blood and iron carrying capacity of blood and bone marrow studies (15).
The importance of RBC indices in diagnosis of anemia can be understood from the details given till now. Let us look at them individually to understand what they are and how it helps.
Mean Corpuscular Volume (MCV)
If the volume of whole RBCs along with the number of RBCs is known, it is easy to find the average volume or size of a single RBC. This is the concept used to measure MCV in an automated analyser.
The issue with looking at only MCV is that it may be insufficient to identify if there are both large and small RBCs. This is because the value is just an average and may show a result which is normal. Other indices will help to identify such an issue, if it occurs (26).
Normal MCV- 80-96 fL (16)
Variations in MCV
The MCV can be lower or higher than the normal values in abnormal conditions. When it falls below 80 fL, the RBCs can be classified as microcytic. ‘Micro’ means smaller and ‘cytic’ is related to cell. Therefore, when the volume has decreased, it indicates that the cell size has decreased.
Conversely, if the MCV is elevated above 100 fL, it can be diagnosed as macrocytic. These variations in size are normally seen when there is anemia.(15, 25)
Microcytic anemia
When the RBC size is decreased, the hemoglobin content of the RBC also decreases. This is demonstrated by a decreased MCH (Mean Corpuscular Hemoglobin). As we know that the hemoglobin is what gives colour to the RBC, when it decreases we call it hypochromic.
In general, when MCV and MCH decrease, we can diagnose microcytic hypochromic anemia.(15)
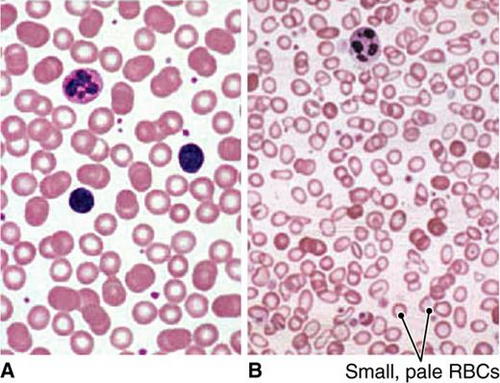
Picture 6: Peripheral smear.
Photo Source: 5minuteconsult.com
Causes of Microcytic Hypochromic anemia
| CAUSE | DUE TO |
| Iron deficiency (15) | Decreased iron availability |
| Copper deficiency | |
| Anemia of chronic inflammation | |
| Lead poisoning | Heme synthesis abnormalities (acquired) |
| Acquired sideroblastic anemia | |
| Hemoglobinopathies including Thalassemia | Globin synthesis abnormalities |
| Congenital sideroblastic anemia | Congenital |
| Porphyria | |
| Iron absorption, transport and utilization abnormalities |
Table 3: Causes of microcytic hypochromic anemia (15)
The most common among these is Iron deficiency anemia. For a diagnosis of the same, we will have to do further investigations targeting Serum iron concentration, Serum ferritin levels and Serum iron binding capacity.
According to their values, iron deficiency can be classified as below.
| Condition | Test | Reference value |
| Normal | Serum Iron concentration | 60-150 mcg/dL |
| Total Iron binding capacity | 300-360 mcg/dL | |
| Serum Ferritin | 40-200 ng/mL | |
| Iron deficiency without anemia | Serum Iron concentration | 60-150 mcg/dL |
| Total Iron binding capacity | 300-390 mcg/dL | |
| Serum Ferritin | <40 ng/mL | |
| Iron deficiency with mild anemia | Serum Iron concentration | <60 mcg/dL |
| Total Iron binding capacity | 350-400 mcg/dL | |
| Serum Ferritin | <20 ng/mL | |
| Severe Iron deficiency with severe anemia | Serum Iron concentration | <40 mcg/dL |
| Total Iron binding capacity | >410 mcg/dL | |
| Serum Ferritin | <10 ng/mL |
Table 4: Identification of severity of iron deficiency anemia (27). The bold red font values indicate the values at which diagnosis can be made easily.
Macrocytic Anemia
When the MCV is more than 100 fL, RBCs are called macrocytic. Causes of macrocytic anemia are listed below.
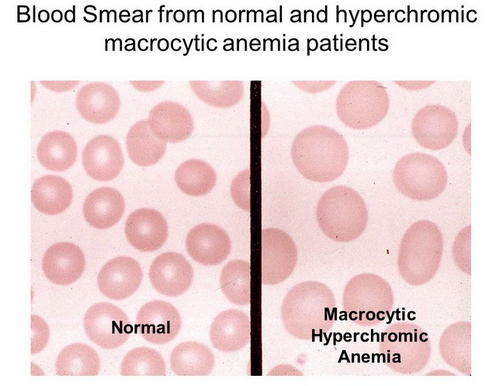
Picture 7: An image comparing peripheral smears showing normal RBC and macrocytic RBC.
Image Source: slideplayer.com
| Nucleic Acid Metabolism abnormalities | Vitamin B12 deficiency |
| Folic acid deficiency | |
| Drugs- Antiretroviral therapies, Azathioprine, Hydroxyurea, Methotrexate etc | |
| Immature RBCs | Reticulocytosis |
| Stress erythrocytosis, skip macrocytes | |
| Aplastic anemia | |
| Pure red cell aplasia | |
| Bone marrow disorders (Primary) | Myelodysplastic syndromes |
| Congenital dyserythropoietic anemia | |
| Lipid abnormalities | Liver disease |
| Hypothyroidism | |
| Unknown mechanism | Alcohol abuse |
| Multiple myeloma |
Table 5: Causes of Macrocytic anemia (28)
Normocytic anemia
If the MCV values are within the normal range, then the RBCs are of normal size. This may be seen in certain systemic conditions such as anemia of chronic renal disease, cardio-renal anemia syndrome, cancer-associated anemia and acquired anemia in hospitalized patients (15).
Mean Corpuscular Hemoglobin (MCH)
The average amount of hemoglobin in a RBC can be called as mean corpuscular hemoglobin. When the hemoglobin content of the RBC decreases, the MCH values will decrease and the value increases with hemoglobin content increase.
In fact, MCH values reflect the action of MCV values. This is because when the volume of RBC decreases, the hemoglobin content also decreases. Hence, the causes of MCV and MCH increase or decrease remains the same.
Hypochromia (decreased colour) can be noticed well on a peripheral smear examination.(15)
Normal MCH – 28-33 pg/RBC (16)
Mean Corpuscular Hemoglobin Concentration (MCHC)
It is the average concentration of hemoglobin in a particular unit of RBC (15). It is a calculated value from hematocrit and serum hemoglobin levels (15).
We have already seen what decreases the hemoglobin content of RBC. Anemia in general causes a decrease in hemoglobin concentration (15).
Normal MCHC – 33-36 g/dL of RBC (16)
Causes of Decreased MCHC
- Anemia- Usually in Iron deficiency anemia, thalassemia, and sideroblastic anemia (26, 29).
- Malabsorption due to coeliac disease, H. pylori infection or gastric surgery.
The symptoms which are seen in cases of decreased MCHC are same as those seen in anemia. The cause of anemia will have to be detected and treated accordingly for a full recovery and bringing back the values to the normal range. The diagnosis can be correlated by examining a peripheral smear preparation of blood.
Causes of Increased MCHC
- Spherocytosis- RBC loses its oval biconcave shape and becomes spherical. Usually seen in hereditary spherocytosis and autoimmune haemolytic anemia (15,26).
- RBC agglutination
RBC Distribution Width (RDW)
RDW is the measure of degree of variation in the size of RBCs. When there is a large variation between the sizes, it results in a high RDW. Conversely, if there is less variation or no variation in the sizes, the RDW is low (15).
That means the RBCs are identical in their sizes. When they have different sizes or RDW is high, we call it as ‘Anisocytosis’. The term ‘Width’ in RDW refers to the width of the volume curve and not width of the RBC (31). The volume curve is a MCV histogram (32).
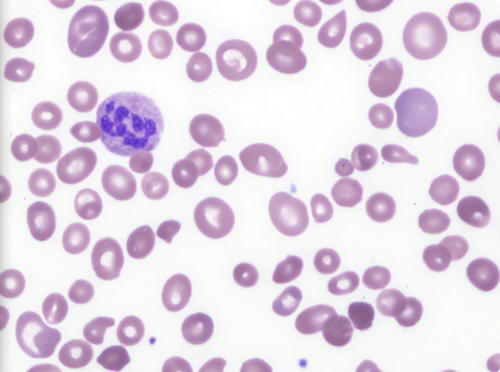
Picture 8: Peripheral blood film of a patient, with severe Vitamin B12 deficiency, showing marked anisocytosis.
Photo Source: www.bloodjournal.org
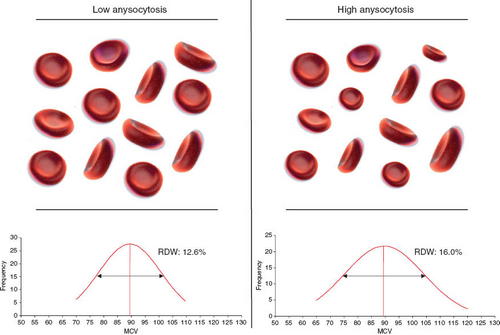
Picture 9: The variation in low and high anisocytosis can be seen in this image.
Image Source: www.degruyter.com
Normal RDW values are as follows
- RDW-SD- 39-46 fL (30) (SD refers to standard deviation in femtolitres)
- RDW-CV- 12- 15 % (16) (CV refers to coefficient of variation)
Anisocytosis, the difference in cell sizes occurs as normocytic, microcytic or macrocytic. We have seen above the causes and details for each. By finding RDW and MCV and using them in conjunction, a correct diagnosis can be reached on to regarding the cause of anemia.
A detailed investigation to unravel the exact cause will help to pinpoint the diagnosis and its treatment.
Grading of anisocytosis is done based on the degree of variation from the normal size. The grades given are + (Mild/ 1+), ++ (Moderate/2+) or +++ (Severe/3+).
Based on RDW, the grades are
- +/ Mild/ 1+ Anisocytosis- When RDW= 16 to 18
- ++/ Moderate/ 2+ Anisocytosis- When RDW = 18 to 22
- +++/ Severe/ 3+ Anisocytosis- When RDW >22
Reticulocyte Count
As we had discussed earlier, a mature RBC does not have nucleus and most of the other organelles. Initially during their development, they do possess all of these organelles along with the nucleus.
At one stage they remove these organelles except the ribosomal network that helps it in limited protein and hemoglobin synthesis (15). This can be seen on supravital staining (methylene blue). Now they are called as reticulocytes (15).
Under normal conditions, reticulocytes retain the ribosomes for around 4 days out of which first 3 days they remain in the bone marrow and 1 day in the peripheral blood (15). Then they lose the ribosomes and become a mature RBC (15).
Normal Reticulocyte percentage in blood- 0.5-2% (15)
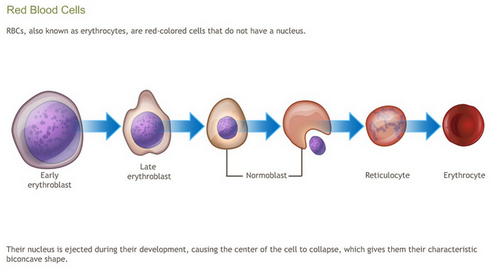
Picture 10: An image showing the process of RBC formation in the body.
Photo Source: www.adamondemand.com
Causes of high reticulocyte percentage
Reticulocyte count in peripheral blood can go high when the bone marrow tries to produce more RBC in response to a high requirement (33). This can be seen in
- Hemolytic anemia (33)
- Excessive bleeding (33)
- Erythropoietin administration (33)
- Supplementation with iron, Vitamin B12 or Folic acid (33)
Causes of low reticulocyte percentage
Reticulocyte count indicates the functioning of bone marrow in relation to erythropoiesis. It may decrease in certain conditions such as
- Bone marrow suppression (26)
- Aplastic anemia (26)
- Pure red cell aplasia (26)
- Systemic chemotherapy (26)
Conclusion
RBCs being the largest population of cells in our circulation and having important functions in oxygen delivery to the tissues, it is important for them to be of appropriate shape size and content.
When they are decreased, it leads to anemia which affects the normal functioning of many tissues and organs of our body. Identifying the type of anemia, their diagnosis and treatment is largely dependent on the findings of RBC indices and a peripheral smear of blood.
References:
- Lee, Lan Na (1998). “Volume of Blood in a Human”. The Physics Factbook.
- The Franklin Institute Inc. “Blood – The Human Heart”
- en.wikipedia.org/wiki/Blood
- “Medical Encyclopedia: RBC count”. Medline Plus.
- Ganong, William F. Review of medical physiology (21 ed.). New York: Lange Medical Books/McGraw-Hill. p. 518
- https://en.wikipedia.org/wiki/Red_blood_cell
- Bianconi, Eva; Piovesan, Allison; Facchin, Federica; Beraudi, Alina; Casadei, Raffaella; Frabetti, Flavia; Vitale, Lorenza; Pelleri, Maria Chiara; Tassani, Simone (2013-11-01).40 (6): 463–471.
- J. A. Blom (15 December 2003). Monitoring of Respiration and Circulation. CRC Press. p. 27.
- Pierigè F, Serafini S, Rossi L, Magnani M (January 2008). 60 (2): 286–95.
- Hillman, Robert S.; Ault, Kenneth A.; Rinder, Henry M. (2005). McGraw-Hill Professional. p. 1
- Mary Louise Turgeon (2004). Clinical Hematology: Theory and Procedures. Lippincott Williams & Wilkins. p. 100.
- McLaren CE, Brittenham GM, Hasselblad V (April 1987). Am. J. Physiol. 252 (4 Pt 2): H857–66
- Prahl. “Optical Absorption of Hemoglobin”
- https://en.wikipedia.org/wiki/Hemoglobin
- https://www.uptodate.com/contents/approach-to-the-adult-patient-with-anemia
- https://www.uptodate.com/contents/image?imageKey=HEME%2F64238&topicKey=HEME%2F7133&search=Peripheral%20blood%20smear%20in%20iron%20deficiency%20anemia%20showing%20microcytic,%20hypochromic%20red%20blood%20cells.&rank=1~150&source=see_link
- https://en.wikipedia.org/wiki/Hematocrit
- Lipowsky, Herbert H.; Usami, Shunichi; Chien, Shu; Pittman, Roland N. (1982). 24 (1): 42–55
- Zubieta-Calleja, G. R.; Paulev, P. E.; Zubieta-Calleja, L; Zubieta-Castillo, G (2007). 58 Suppl 5 (Pt 2): 811–18.
- https://medlineplus.gov/ency/article/003646.htm
- https://emedicine.medscape.com/article/215840-workup
- https://www.uptodate.com/contents/causes-and-diagnosis-of-iron-deficiency-and-iron-deficiency-anemia-in-adults
- https://www.uptodate.com/contents/anemia-of-chronic-disease-inflammation
- https://www.uptodate.com/contents/hemolytic-anemia-due-to-drugs-and-toxins
- http://www.healthyandnaturalworld.com/mcv-blood-test/
- https://www.uptodate.com/contents/evaluation-of-the-peripheral-blood-smear
- https://www.uptodate.com/contents/image?imageKey=HEME%2F76236&topicKey=HEME%2F7133&source=see_link
- https://www.uptodate.com/contents/image?imageKey=HEME%2F66772&topicKey=HEME%2F7133&source=see_link
- http://www.healthyandnaturalworld.com/mchc-blood-test/
- Briggs C, Bain BJ. Basic Haematological Techniques. Bain BJ, Bates I, Laffan M, Lewis SM. Dacie and Lewis Practical Haematology. 11th ed. Philadelphia, PA: Churchill Livingstone/Elsevier; 2012. chap 3.
- https://en.wikipedia.org/wiki/Red_blood_cell_distribution_width
- https://www.uptodate.com/contents/microcytosis-microcytic-anemia
- https://www.uptodate.com/contents/diagnosis-of-hemolytic-anemia-in-the-adult?sectionName=High%20reticulocyte%20count&anchor=H3882494893&source=see_link#H3882494893